In this chapter, you’ll learn how to install software to monitor your Metal Blockchain node, so you’ll be able to monitor your node on a slick dashboard.
First, we’re going to install Graphana software. Make sure you have admin privileges. Enter the command below in your terminal.
wget -nd -m https://raw.githubusercontent.com/MetalBlockchain/metal-monitoring/main/grafana/monitoring-installer.sh ;\
chmod 755 monitoring-installer.sh;
Next, to make sure it is downloaded and set up correctly, begin by running:
It should display:
Usage: ./monitoring-installer.sh [–1|–2|–3|–4|–5|–help]
Options:
–help Shows this message
–1 Step 1: Installs Prometheus
–2 Step 2: Installs Grafana
–3 Step 3: Installs node_exporter
–4 Step 4: Installs MetalGo Grafana dashboards
–5 Step 5: (Optional) Installs additional dashboards
Run without any options, script will download and install latest version of MetalGo dashboards.
Next, we’re going to install Prometheus software. Enter the command below in your terminal.
You may be prompted to confirm additional package installs, do that if asked. Script run should end with instructions on how to check that Prometheus installed correctly. Let’s do that, run:
sudo systemctl status prometheus
It should output something like:
● prometheus.service – Prometheus
Loaded: loaded (/etc/systemd/system/prometheus.service; enabled; vendor preset: enabled)
Active: active (running) since Fri 2021-11-12 11:38:32 UTC; 17min ago
Docs: https://prometheus.io/docs/introduction/overview/
Main PID: 548 (prometheus)
Tasks: 10 (limit: 9300)
Memory: 95.6M
CGroup: /system.slice/prometheus.service
└─548 /usr/local/bin/prometheus –config.file=/etc/prometheus/prometheus.yml –storage.tsdb.path=/var/lib/prometheus –web.console.templates=/etc/prometheus/con>
Nov 12 11:38:33 ip-172-31-36-200 prometheus[548]: ts=2021-11-12T11:38:33.644Z caller=head.go:590 level=info component=tsdb msg=”WAL segment loaded” segment=81 maxSegment=84
Nov 12 11:38:33 ip-172-31-36-200 prometheus[548]: ts=2021-11-12T11:38:33.773Z caller=head.go:590 level=info component=tsdb msg=”WAL segment loaded” segment=82 maxSegment=84
Next, we’re going to install Graphana. Enter the command below in your terminal.
Next, we’re making sure it’s running properly: Enter the command below in your terminal.
sudo systemctl status grafana-server
Which should show grafana as active.
Next, we’re going to install a Prometheus plugin that can check CPU, memory, network and disk usage etc. Enter the command below in your terminal.
Next, we’ll check that the service is running correctly. Enter the command below in your terminal.
sudo systemctl status node_exporter
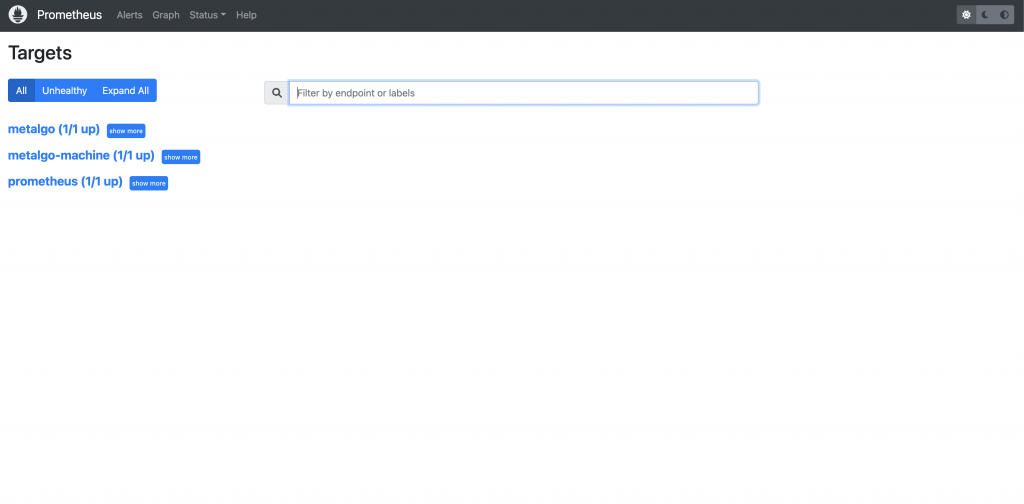
If the service is running, Prometheus, Grafana and node_exporter should all work together now. To check, in your browser visit Prometheus web interface on http://yourip:9090/targets
Note: yourip should be changed with your machine’s IP in the link above.
You should see three targets enabled:
- Prometheus
- metalgo
- metalgo-machine
Make sure that all of them have State as UP as seen in the screenshot below.

Next, we’re going to install the dashboard. Enter the command below in your terminal.
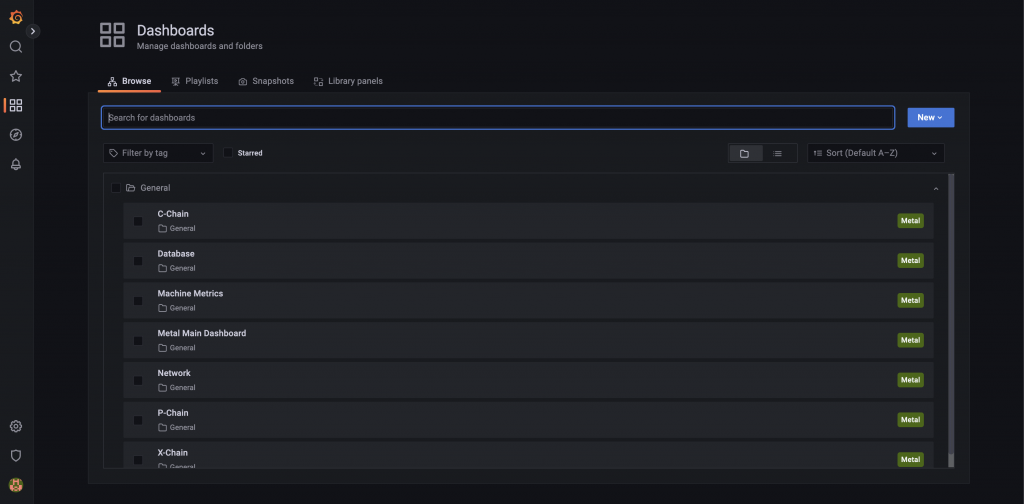
This will download the latest versions of the dashboards from GitHub and provision Grafana to load them, as well as define Prometheus as a data source. It may take up to 30 seconds for the dashboards to show up. In your browser, visit: http://yourip:3000/dashboards
Log in with admin as the username and password and you’ll be prompted to change the password.
Note: yourip should be changed to your machine’s IP in the link above.
You should see 7 Metal dashboards:

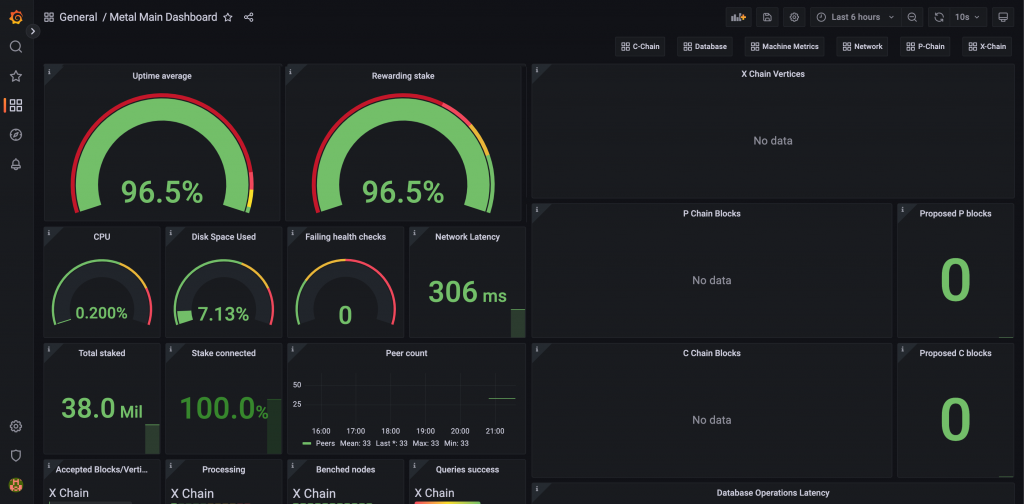
Select ‘Metal Main Dashboard’ by clicking its title. It should load, and look similar to this:

Congratulations, you now installed the monitor software to monitor your node and completed all the chapters in the node series!
You can always join the official Metal Blockchain Validator Telegram chat if you need more help or have more questions.


